G0W0 quasiparticle band structure from FHI-aims data#
This tutorial calculates the one-shot GW quasiparticle band structure of silicon. FHI-aims performs the PBE calculation and writes the GreenX/LibRPA dataset; the LibRPA driver then evaluates the quasiparticle energies on the regular k-grid and along the requested band path.
Note
The numerical settings below are intended to demonstrate the workflow. Check basis-set, k-point, and frequency-grid convergence before using the results in production calculations.
1. Prerequisites#
You need:
FHI-aims built with GreenX support (
USE_GREENX=ON);LibRPA built with the driver and
LIBRPA_USE_LIBRI=ON; andan MPI launcher compatible with both executables.
2. Generate the FHI-aims dataset#
The example uses PBE, a 4 × 4 × 4 k-grid, 16 minimax frequency points, and two
band-path segments, L–Γ and Γ–X. The relevant part of control.in is:
# Basic model
xc               pbe
k_grid           4 4 4
occupation_type  gaussian 0.001

# GW switches
qpe_calc         gw_expt
frequency_points 16
anacon_type      1

# Band k-paths
output band   0.50000  0.50000  0.50000   0.00000  0.00000  0.00000 13 L G
output band   0.00000  0.00000  0.00000   0.50000  0.00000  0.50000 13 G X

# Export dataset for LibRPA
output librpa

[light species default for Si]
Most settings are the same as in a standard periodic GW calculation in
FHI-aims; output librpa is the key addition.
The corresponding geometry.in is:
lattice_vector   3.8301668167   0.0000000000   0.0000000000
lattice_vector   1.9150834084   3.3170217640   0.0000000000
lattice_vector   1.9150834084   1.1056739213   3.1273181102
atom_frac        0.0000000000   0.0000000000   0.0000000000  Si
atom_frac        0.2500000000   0.2500000000   0.2500000000  Si
Place both files in a dataset directory and run FHI-aims there:
cd dataset
mpirun -np 4 /path/to/aims.x > aims.out 2> aims.err
The output librpa directive writes the structure, basis, eigenstate, RI
coefficients, Coulomb matrices, dielectric head, and band-path data required by
the LibRPA driver. The generated dataset for this example is about 500 MiB.
Its size and generation time depend strongly on the basis and numerical grids.
3. Configure LibRPA#
Create a sibling librpa directory containing this librpa.in:
task = g0w0
input_dir = ../dataset
nfreq = 16
option_dielect_func = 0
replace_w_head = t
parallel_routing = libri
task = g0w0 calculates both regular-k-grid and band-path quasiparticle
energies when band-path data are present. nfreq must match the FHI-aims
frequency grid.
replace_w_head uses the macroscopic dielectric function written by FHI-aims
to correct the head of the dielectric matrix and improve k-point convergence.
4. Run LibRPA#
Run the driver from the librpa directory so that input_dir = ../dataset
resolves correctly:
cd librpa
export OMP_NUM_THREADS=1
mpirun -np 4 /path/to/LibRPA/build/chi0_main.exe > librpa.out 2> librpa.err
A successful run ends with libRPA finished successfully. The run used to
refresh this tutorial employed four MPI ranks and one OpenMP thread per rank
and took about 1.4 hours. Runtime is hardware-dependent, and additional
MPI ranks or OpenMP threads may reduce it.
5. Inspect the quasiparticle energies#
The first regular-k-grid block in the refreshed librpa.out includes:
Printing quasi-particle energy [unit: eV]

spin  1, k-point    1: (0.00000, 0.00000, 0.00000)
----------------------------------------------------------------------------------------------------------------------------
State              occ             e_mf             v_xc            v_exx           ReSigc           ImSigc             e_qp
----------------------------------------------------------------------------------------------------------------------------
    1          2.00000      -1789.50277       -153.07760       -244.87703          8.90361          3.15363      -1872.39859
...
   11          2.00000        -17.67291        -12.19859        -19.21812          6.69555         -0.86361        -17.99689
   12          2.00000         -5.63619        -13.27559        -14.75075          1.24875         -0.00015         -5.86260
   13          2.00000         -5.63548        -13.27912        -14.75356          1.24872         -0.00015         -5.86120
   14          2.00000         -5.63533        -13.27943        -14.75386          1.24867         -0.00015         -5.86108
   15          0.00000         -3.07993        -11.57831         -7.20939         -3.90057         -0.01063         -2.61157
   16          0.00000         -3.07901        -11.57980         -7.21005         -3.90144         -0.01064         -2.61070
   17          0.00000         -3.07776        -11.58158         -7.21096         -3.90159         -0.01066         -2.60874
   18          0.00000         -2.14654        -14.88107         -9.67057         -4.69196         -0.01374         -1.62800
...
The columns contain:
State: one-based band index \(n\);occ: input occupation \(f_{nk}\);e_mf: input Kohn–Sham eigenvalue \(E^{\mathrm{KS}}_{nk}\);v_xc: input exchange-correlation potential \(v^{\mathrm{xc}}_{nk}\);v_exx: exact-exchange potential \(v^{\mathrm{exx}}_{nk}\);ReSigcandImSigc: real and imaginary parts of the correlation self-energy \(\Sigma^{\mathrm{c}}_{nk}\); ande_qp: quasiparticle energy\[ E^{\mathrm{QP}}_{nk} = E^{\mathrm{KS}}_{nk} - v^{\mathrm{xc}}_{nk} + v^{\mathrm{exx}}_{nk} + \Re\Sigma^{\mathrm{c}}_{nk}. \]
All energies in this table are in eV.
6. Plot the band structure#
When band-path data are present, task = g0w0 writes:
KS_band_spin_<ispin>.dat: input Kohn–Sham band structure;EXX_band_spin_<ispin>.dat: non-self-consistent exact-exchange band structure; andGW_band_spin_<ispin>.dat: GW quasiparticle band structure.
These files follow the FHI-aims band-output format. Their raw energies use LibRPA’s internal energy zero, so choose and document a common reference when comparing calculations. The plot below aligns the PBE and GW results to their respective valence-band maxima and omits the five highest bands, which exhibit large errors from the localized resolution-of-identity approximation.
For this example, both calculations yield an indirect fundamental gap, with the valence-band maximum at Γ and the conduction-band minimum along Γ–X. The gap is 0.57 eV for PBE and 1.08 eV for GW. These values should not be treated as fully converged.
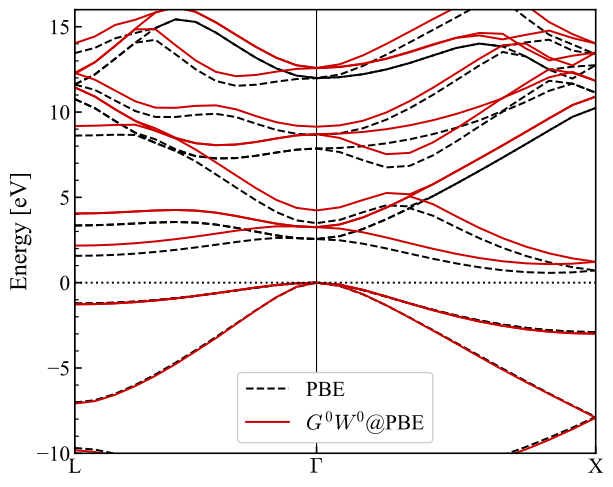
Fig. 1 PBE and one-shot GW band structures of silicon.#
The result archive contains the complete FHI-aims and LibRPA inputs, the refreshed outputs, the three band files, the generated figure, and the plotting script. The script uses NumPy and Matplotlib.